Member-only story
Creating Dataviz Using the Video Game ‘Townscaper’
Visualizing the price of Bitcoin, inflation, and Facebook’s stock price using cute wee little buildings

(Want to try my tool that turns data into a Townscaper town? It’s here!)
I’m a big fan of Townscaper, the gorgeous little indie video game.
I’m not quite sure it’s a “game,” mind you. There’s no way to win or lose. All you do is create Mediterranean-looking villas against a watery backdrop — calmly placing building by building into place, each time producing a “plink” noise that palpably renews the soul.
So it’s more like a creative toy, or a piece of extremely odd architectural software. There are moments of surprise and delight, as when a building attaches at an unexpected angle, or a flock of birds appears on a roof. But mostly it’s just a dreamy zone-out experience — architecture as meditation.
A few days ago, I was placing houses in a long row, with varying heights. And when I looked at the jagged result, I thought:
Hey, that looks like a bar chart!
That made me wonder, hmmm, could I use Townscaper as a dataviz tool? Could I write code that takes data and turns it into a row of buildings?
A quick bit of Googling found that indeed, I could.
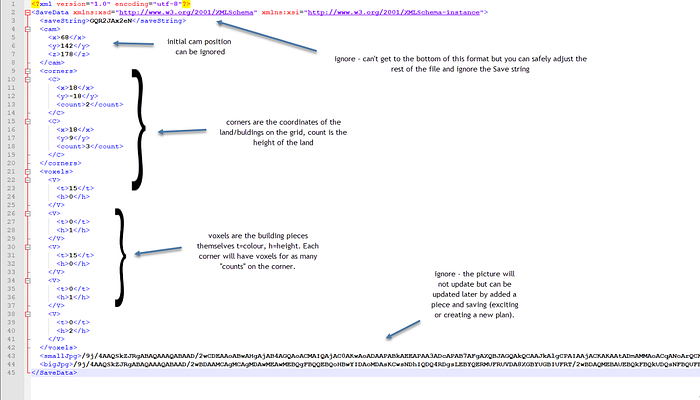
It turns out that each Townscaper town is saved as an XML file. Chris Love wrote a terrific analysis of how the XML works…

…and using this scheme, Love was able to algorithmically generate new towns. Another programmer, Dan Malec, leapt off Love’s work to create even more wildly sprawling auto-generated towns.
After an evening of tinkering, I had my concept working: a script that takes any column of data and uses it to create a row of buildings, where the height of the buildings is crudely associated with the data value. Specifically, I take the largest value in the given data set and divide it by 20, then calculate how many floors each smaller value ought proportionally to be. So the largest value will be a…

